
Choosing Between UPRO vs. TQQQ for your Leveraged ETF Strategy in 2026
This comprehensive guide compares their structures, performance, and risks, offering actionable insights for investors seeking to optimize their leveraged ETF strategy.


In the world of investing, leveraged exchange-traded funds (ETFs) offer a powerful way to amplify returns, but they come with heightened risks that demand careful consideration. Two of the most popular 3x leveraged ETFs are UPRO (ProShares UltraPro S&P 500) and TQQQ (ProShares UltraPro QQQ). These funds provide investors with triple the daily performance of their underlying indices, the S&P 500 for UPRO and the Nasdaq-100 for TQQQ, making them attractive for those seeking to capitalize on market momentum. But the key question remains, should you incorporate one, both, or neither into your leveraged ETF strategy?
This comparative deep dive expands on the fundamentals of these ETFs, exploring their structures, performance histories, risks, and potential synergies. We'll examine how they differ in exposure, volatility, and suitability for various investor profiles. More importantly, we'll discuss how alphaAI's AI-driven platform can help manage these high-octane instruments by focusing on risk mitigation rather than aggressive gain-chasing. By limiting losses through automated, data-driven strategies, alphaAI turns the potential pitfalls of leveraged ETFs into opportunities for sustainable wealth building.
As of December 2025, with markets continuing to evolve amid technological advancements and economic shifts, understanding these tools is more crucial than ever. Leveraged ETFs like UPRO and TQQQ have delivered impressive returns in bull markets, but their daily compounding mechanics can lead to unexpected outcomes over longer periods. Let's break it down step by step.
Understanding Leveraged ETFs: The Basics
Before diving into UPRO and TQQQ specifically, it's essential to grasp what leveraged ETFs are and how they function. Leveraged ETFs aim to deliver multiples (in this case, 3x) of the daily returns of an underlying index using financial derivatives like swaps, futures contracts, and options. This leverage is reset daily, which means the funds rebalance their positions at the end of each trading day to maintain the targeted multiplier.
For example, if the underlying index rises by 1% in a day, a 3x leveraged ETF should aim to rise by 3% (before fees and expenses). Conversely, a 1% drop in the index would result in a 3% loss for the ETF. However, this daily reset introduces compounding effects that can cause the ETF's performance to deviate significantly from 3x the index's return over extended periods. In volatile markets, this can lead to "volatility decay," where the ETF underperforms even if the index ends flat or slightly up over time.
Leveraged ETFs are not designed for buy-and-hold strategies without active management. They thrive in trending markets but can erode value in sideways or choppy conditions. According to historical analyses, holding periods longer than a few days or weeks amplify risks due to these compounding effects. This is why tools like alphaAI's automated risk management become invaluable, they monitor real-time data to adjust exposure dynamically, helping investors avoid the worst drawdowns.
UPRO: Broad Market
UPRO, launched by ProShares on June 23, 2009, seeks to provide three times the daily performance of the S&P 500 Index. The S&P 500 is a benchmark comprising 500 of the largest U.S.-listed companies, offering broad exposure to the American economy across sectors like technology, healthcare, finance, and consumer goods.
Key Features and Holdings
- Underlying Index: S&P 500, with 503 companies as of September 30, 2025. Key metrics include a price/earnings ratio of 28.25, price/book ratio of 5.47, and dividend yield of 1.17%.
- Leverage: 3x daily.
- Expense Ratio: Gross 0.89%, net 0.89% (with contractual waiver through September 30, 2026).
- Holdings: UPRO achieves its leverage through a mix of equity swaps, futures, and direct stock holdings. Top holdings as of December 22, 2025, include NVIDIA (4.59%), Apple (4.12%), Microsoft (3.71%), and Amazon (2.28%). Swaps with counterparties like UBS AG (34.51%) and Barclays (32.99%) form a significant portion, alongside E-mini S&P 500 futures (10.85%). Cash equivalents like Treasury Bills provide liquidity.
- Performance Metrics: As of November 30, 2025, UPRO's year-to-date NAV return was 33.30%, with a 1-year return of 22.09% and a 10-year annualized return of 27.18%. Over the past decade, it has turned a hypothetical $10,000 investment into significantly more, though with substantial volatility. Market price as of December 22, 2025, was $117.90, with an average daily volume of around 2.2 million shares.
- Distributions: Quarterly dividends, with the most recent at $0.215526 per share in September 2025.
UPRO's broad diversification makes it a go-to for investors seeking amplified exposure to the overall U.S. market. It's less concentrated than tech-focused funds, which can provide a buffer during sector-specific downturns. However, its high beta (~3.0 vs. S&P 500) means it experiences amplified swings, with historical volatility around 57% over the past year.
Risks Specific to UPRO
While UPRO benefits from the S&P 500's stability, leverage magnifies losses. During the 2022 bear market, it saw drawdowns exceeding 70%, far worse than the index's 25% drop. Counterparty risk from swaps and the potential for imperfect correlation with the index add layers of complexity.
TQQQ: Tech-Driven
TQQQ, also from ProShares and launched on February 9, 2010, targets three times the daily return of the Nasdaq-100 Index. This index focuses on 100 of the largest non-financial companies listed on Nasdaq, heavily weighted toward technology and growth stocks.
Key Features and Holdings
- Underlying Index: Nasdaq-100, with 101 companies as of September 30, 2025. Metrics include a price/earnings ratio of 35.89, price/book ratio of 8.79, and dividend yield of 0.65%.
- Leverage: 3x daily.
- Expense Ratio: Gross 0.97%, net 0.82% (with waiver through September 30, 2026).
- Holdings: Relies on swaps (e.g., Barclays at 28.48%, Goldman Sachs at 26.47%) and direct equities like NVIDIA (9.88%), Microsoft (8.39%), and Apple (8.24%). Treasury Bills support liquidity.
- Performance Metrics: Year-to-date NAV return as of November 30, 2025, was 39.09%, with a 1-year return of 38.11% and a 10-year annualized return of 36.65%. A $10,000 investment from inception would now be worth over $2 million in some scenarios, driven by tech booms. Market price as of December 22, 2025, was $54.25, with high liquidity at 64.8 million shares average daily volume.
- Distributions: Quarterly, with $0.048906 per share in September 2025.
TQQQ's tech-heavy tilt has fueled outsized gains during innovation-driven rallies, but it also heightens exposure to sector volatility. Its beta is around 3.5 vs. the S&P 500, with past-year volatility at 71.93%.
Risks Specific to TQQQ
TQQQ's concentration in tech amplifies risks during downturns, like the 81% drawdown in 2022. Volatility decay is more pronounced here due to the Nasdaq-100's higher swings, and compounding can erode value in non-trending markets.
Head-to-Head Comparison: UPRO vs TQQQ
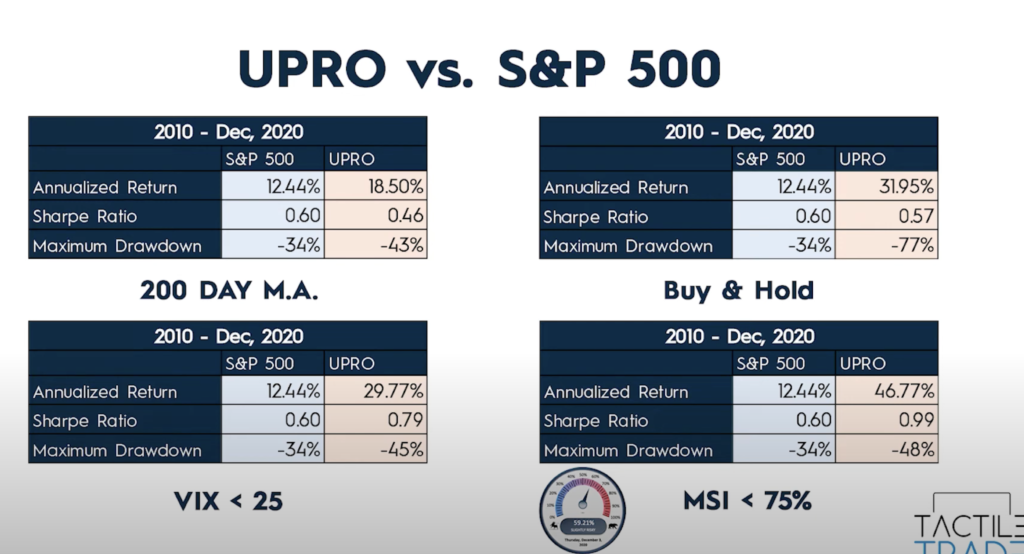
When comparing UPRO and TQQQ head-to-head, several metrics highlight their differences. Below is a generic comparison based on fundamental features, serving as a starting point. Of course, real-world performance depends on market conditions, but this overview provides clarity on how alphaAI might integrate them.
Expanding beyond the table, historical performance shows TQQQ outperforming UPRO over the past 10 years with an annualized return of 37.15% versus 27.85% for UPRO. This edge stems from the Nasdaq-100's tech dominance, which has driven gains in AI, cloud computing, and electric vehicles. However, TQQQ's Sharpe ratio (0.48) is slightly lower than UPRO's (0.58), indicating poorer risk-adjusted returns due to higher volatility.
Year-to-date in 2025, TQQQ returned 38.04% compared to UPRO's 33.93%, reflecting ongoing tech strength. Assets under management (AUM) favor TQQQ at $30.3 billion versus UPRO's $4.64 billion, enhancing liquidity.
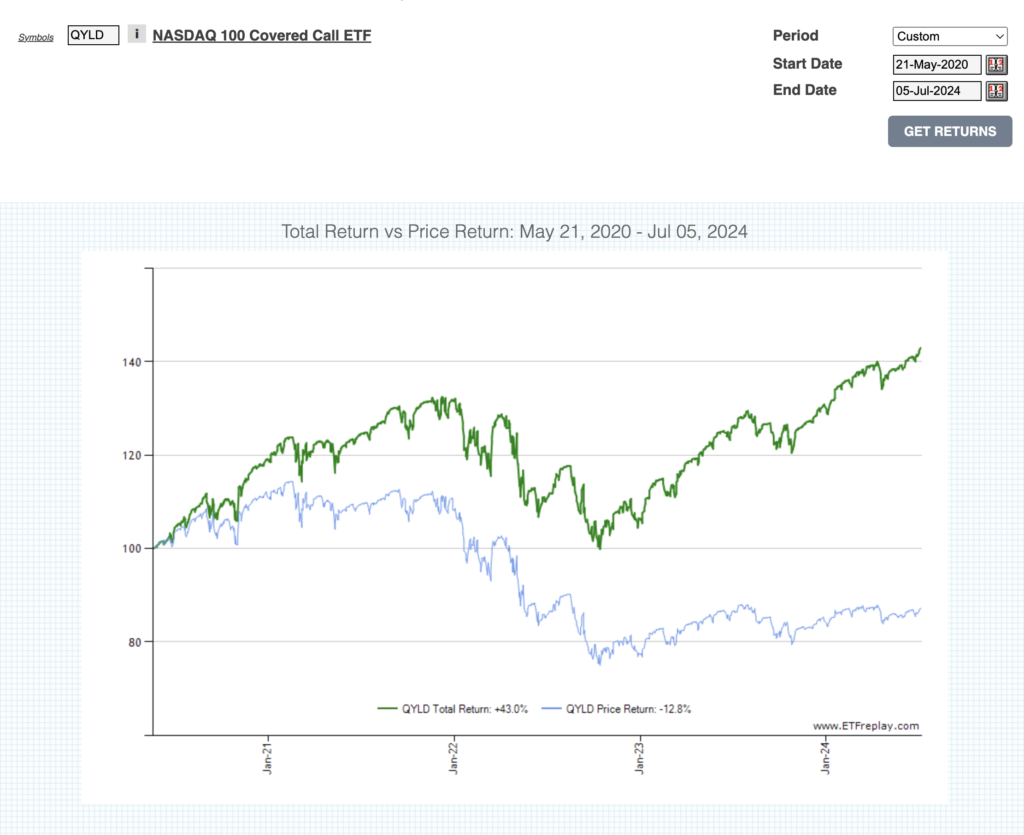
To visualize this, here's a historical performance chart comparison:
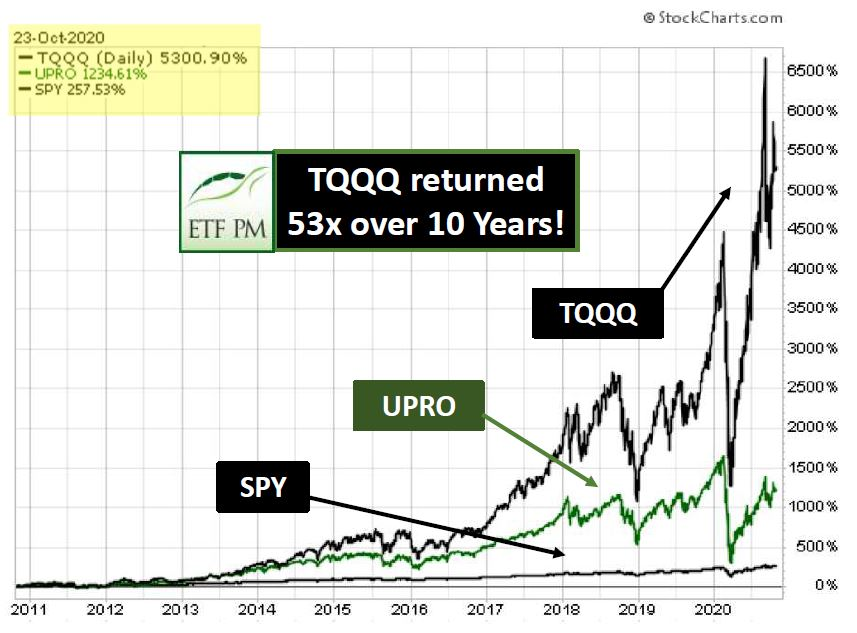
Another perspective on long-term growth:
And a battle-style graph from 2020 data, updated conceptually:
Risks and Considerations for Leveraged ETFs
Investing in UPRO or TQQQ manually is hard even for the experts. Key risks include:
- Volatility Decay: Daily rebalancing can cause losses even in flat markets. For instance, if an index oscillates, the 3x ETF may end lower due to compounding.
- Amplified Drawdowns: TQQQ dropped 81% in 2022, while UPRO fell 70%. Recovery requires even larger gains, a 70% loss needs a 233% rebound.
- Counterparty and Liquidity Risks: Reliance on derivatives exposes investors to default risks from banks like Barclays or Goldman Sachs.
- Psychological Factors: Extreme swings can lead to emotional selling at lows.
- Regulatory and Event Risks: Flash crashes or policy changes could trigger liquidations, though UPRO and TQQQ's large AUM reduces this likelihood.
Studies show that without hedging, long-term holds of 3x ETFs underperform in choppy markets. This is where alphaAI shines.
alphaAI, TQQQ & UPRO: Building Wealth by Limiting Losses
At alphaAI, we believe that true wealth building with leveraged ETFs like UPRO and TQQQ comes from limiting losses, not chasing gains. How many times has your portfolio soared, only to crash during the next correction? Research demonstrates that avoiding the market's worst days yields far higher long-term returns than capturing every upside.
For instance, over a 25-year period in the S&P 500 starting with $100,000:
- Missing the 10 highest return days: -50% portfolio value.
- Missing both the 10 best and worst days: 1.2x growth.
- Missing the 10 worst days only: 2.5x growth.
These stats underscore the power of downside protection. alphaAI's AI algorithms analyze real-time market data, sentiment, and indicators to dynamically adjust exposure to UPRO and TQQQ. By hedging with inverse ETFs like SQQQ or reducing leverage during high-risk periods, we eliminate emotional decisions, reducing drawdowns.
Active Risk Management with alphaAI
alphaAI automatically manages risks associated with UPRO and TQQQ in response to market conditions. Our platform uses predictive AI, superior to generative models for investing, to forecast trends and optimize portfolios. Benefits include:
- Dynamic Leverage Adjustment: AI scales exposure based on volatility, potentially reducing it during turbulent times.
- Portfolio Optimization: Sophisticated techniques minimize risk while maximizing returns, often outperforming human-managed funds.
- Tax Efficiency: Through strategies like tax-loss harvesting, alphaAI enhances after-tax returns.
- Emotional Detachment: Algorithms avoid bias, ensuring consistent execution.
In alphaAI's default strategy, which incorporates TQQQ and SQQQ, real client accounts have shown superior risk-adjusted performance compared to passive holds. For those blending UPRO and TQQQ, the high, but not perfect, correlation provides diversification, UPRO's broad base complements TQQQ's tech focus.
Case Studies: Hypotheticals and Real-World Insights
Consider a hypothetical portfolio: 50% UPRO and 50% TQQQ from 2015 to 2025. Backtests show annualized returns around 32%, but with max drawdowns of 75% during COVID-19. With alphaAI's hedging, simulations reduce drawdowns to 40-50% while preserving upside.
In real terms, during the 2023-2025 AI boom, TQQQ surged thanks to holdings like NVIDIA, but UPRO provided stability amid broader market dips. alphaAI users benefited from automated rebalancing, capturing tech gains while sidestepping volatility spikes.
Using Both UPRO and TQQQ: Synergies and Strategies
Adding both to your strategy can balance broad market exposure with tech growth. Their correlation is high (due to S&P 500's 30-40% tech weight), but not perfect, offering some diversification. A blended approach might allocate 60% UPRO for stability and 40% TQQQ for upside, adjusted via AI.
However, without management, this amplifies risks. alphaAI's quantitative strategies, including machine learning for trend prediction, make this viable for long-term investors.
UPRO and TQQQ are potent tools for leveraged strategies, with UPRO suiting those wanting diversified market momentum, and TQQQ appealing to tech optimists. Over the past decade, TQQQ's edge in returns (37.15% annualized) highlights its potential, but UPRO's lower volatility (57% vs. 72%) offers balance.
Ultimately, success lies in risk management. alphaAI's AI-powered platform ensures you harness these ETFs' power while protecting against pitfalls. Whether adding one or both, our automated tools, backed by real-time analysis and proven strategies, help grow your AUM sustainably.
Explore alphaAI's strategies today and see how we make leveraged investing smarter.

Latest Articles


Frequently Asked Questions
Find answers to common questions about alphaAI.